Our planet’s surface has important elevation changes. About ¾ are covered by ocean waters, whose medium level has been chosen as a datum point for measuring elevations. The statistical analysis of Earth’s surface elevation shows something intriguing: the highest percentage of elevations gather around two particular values – the average ocean floor elevation (about -3730 m) and the average elevation of the emerged lands (around 840 m).
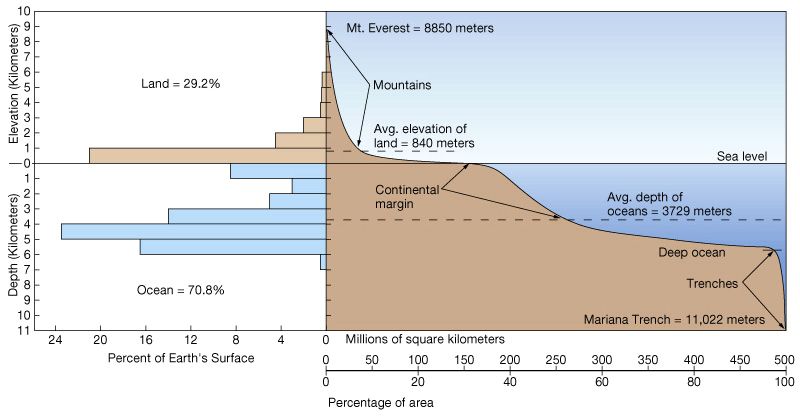
This diagram showing the percentage distribution of Earth’s areas at a certain elevation is called “hypsometric curve” (top). It shows how the percentages of Earth surface that reach the lowest elevations (around -11000 m at the Mariana Trench) and the highest elevations (Mt. Everest’s 8850 m) are a small fraction of the total.
In simple words, mountain belts are an exception on the Earth’s surface, just like ocean trenches.
They appear as chains or belts, as they are more elongated in one direction than in the other. But what is keeping them so high with respect to the rest of the lands above sea level?
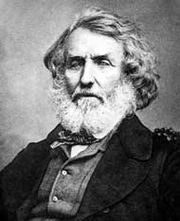
George Everest (1790 – 1866)
Between 1840 and 1850, the Welsh geographer George Everest (1790 – 1866) led the Great Trigonometrical Survey survey of India. The survey, completed in 1971, led to great accomplishments such as the measurement of the height of the greatest Himalayan peaks like Mt. Everest and K2. For the first time, an accurate measurement of a section of an arc of longitude was carried out. Beside new methods developed by Everest himself, also traditional methods were used, based on the traditional triangulation and on the position of a reference star at a certain time of the day. Both methods should have given identical results, but it was not so; the measuring error of the distance between the two cities of Kaliana and Kalianpur, at 100 and 700 km from the Himalayan belt respectively, was too big: the triangulation method gave 150 km more than the astronomical one!

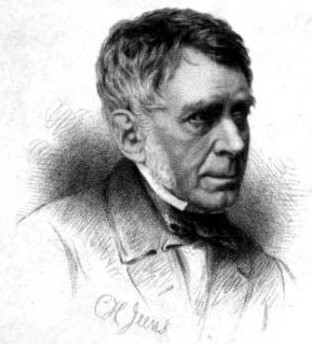
John Henry Pratt (1809-1871)
In 1854, Everest’s successor Andrew Scott Waugh approached Calcutta’s archdeacon John Henry Pratt (1809-1871), a British mathematician in an attempt to understand the issue. Pratt showed how the error was to be found in the astronomical method: in order to determine the position of a star, the zenith direction (the vertical) must be exactly determined with a plumb line. Pratt suggested that the gravitational pull of both Himalaya and Tibetan plateau on the plumb line was stronger to Kaliana, that is closer to the belt than Kalianpur. This would have been the reason for the discrepancy that caused the error. But when he attempted to calculate the error by evaluating the mass of Himalaya and Tibet, he made a bewildering discovery: the calculated error was three times larger than the measured one! The plumb line was deviated from the vertical by a lower angle than expected! (The attraction of the Himalaya Mountains upon the plumbline in India, Pratt 1855).
In other words, the calculation overestimated both Himalaya’s and Tibet’s mass; the mountains exerted a lower gravitational pull than the one calculated by taking into account their estimated density. Furthermore, Pratt based its calculations on the maps of the time that put the belts at less than half the height we know today; therefore he could have calculated an even greater missing mass. Pratt speculated that under the mountains there was some less dense material than the surroundings, something that would have kept the belt afloat according to Archimede’s principle. In Pratt’s hypothesis, the lower density portions of the crust are pushed higher: the thicker the crust, the lower the density, the higher the elevation; therefore, mountain belts, as large crustal thickenings, would “float” like icebergs.
George Biddell Airy (1801 – 1892)
George Biddell Airy (1801 – 1892), royal astronomer and mathematician, read Pratt’s work in his London office. He thought that probably the Earth’s surface is not rigid enough to bear the load of mountain belts with no deformation. Deformation would cause a lack of mass due to the less dense material that would “fill” the bend. Airy opposed Pratt’s lateral density changes with a crust lighter than the subsurface on which it “floats”, with constant density but variable thickness.
As we know today, Pratt’s model better explains ocean floors while Airy’s is more suitable to continental settings. Both have the merit of having applied the principle of Isostasy to the Earth: denser material tend to reach lower elevations. This could explain the two favorite levels on the hypsometric curve as well as the high elevation of mountains.
The continental crust’s average composition is close to that of the granite, which has a density of 2.6 – 2.7 g/cm3; the oceans’ crust have a basalt-like composition, with a density closer to 3 g/cm3 that explains why it levels at lower elevations. This means that the surface material “floats” above the underlying one, which has a higher density and behaves like a fluid, at least for very slow motions.